Tybros (India) Tours Profile
Key Indicators
- Authorised Capital ₹ 2.50 Cr
- Paid Up Capital ₹ 1.11 Cr
- Company Age 22 Year, 1 Month
- Last Filing with ROC 31 Mar 2017
- Open Charges ₹ 8.80 Cr
- Satisfied Charges ₹ 3.00 Cr
- Revenue Growth 51.06%
- Profit Growth 803.43%
- Ebitda 53.50%
- Net Worth 7.46%
- Total Assets 21.49%
About Tybros (India) Tours
Company Details
-
Location
Central Delhi, Delhi, India
-
Telephone
+91-XXXXXXXXXX
-
Email Address
-
Website
-
Social Media
Corporate Identity Details
-
CIN/LLPIN
U63040DL2002PTC118098
-
Company No.
118098
-
Company Classification
Private Limited Indian Non-Government Company
-
Incorporation Date
18 Dec 2002
-
Date of AGM
30 Sep 2017
-
Date of Balance Sheet
31 Mar 2017
-
Listing Status
Unlisted
-
ROC Code
Roc Delhi
Industry
What products or services does Tybros (India) Tours Private Limited offer?
Tybros (India) Tours Private Limited offers a wide range of products and services, including Corporate Event Management, Conference Organizers, Tour Operators and Travel Agents, Tour Packages, Safari Tour Packages, Adventure & Trekking Tours, Adventure Tours, Education Tour, Wildlife Tours, Corporate Training.
Who are the key members and board of directors at Tybros (India) Tours?
Board Members (2)
| Name | Designation | Appointment Date | Status |
|---|---|---|---|
|
Vivek Tyagi
|
Whole-Time Director | 18-Dec-2002 | Current |
|
Vikas Tyagi
|
Director | 18-Dec-2002 | Current |
Financial Performance of Tybros (India) Tours.
Tybros (India) Tours Private Limited, for the financial year ended 2017, experienced significant growth in revenue, with a 51.06% increase. The company also saw a substantial improvement in profitability, with a 803.43% increase in profit. The company's net worth moved up by a moderate rise of 7.46%.


- Key Matrics
- Balance Sheet
- Profit and Loss
- Cash Flow
- Ratios
| Metrics |
|
(FY 2022) | (FY 2021) | (FY 2020) | (FY 2019) | ||
|---|---|---|---|---|---|---|---|
| Total Revenue |
|
||||||
| Revenue from Operations |
|
||||||
| Total Assets |
|
||||||
| Profit or Loss |
|
||||||
| Net Worth |
|
||||||
| EBITDA |
|
What is the Ownership and Shareholding Structure of Tybros (India) Tours?
In 2017, Tybros (India) Tours had a promoter holding of 100.00%. Access key insights, ownership, including shareholding patterns, funding, foreign investors, KMP remuneration, group structure, and overseas investments.
Related Corporates (Common Directorship)
-
 Tybros Infratech Private Limited
Vivek Tyagi and Vikas Tyagi are mutual person
-
 Wbn Infrastructure Private Limited
Vivek Tyagi and Vikas Tyagi are mutual person
-
House Of Vacations India Private Limited
Vivek Tyagi and Vikas Tyagi are mutual person
-
Tybros Mice Tours Private Limited
Vivek Tyagi and Vikas Tyagi are mutual person
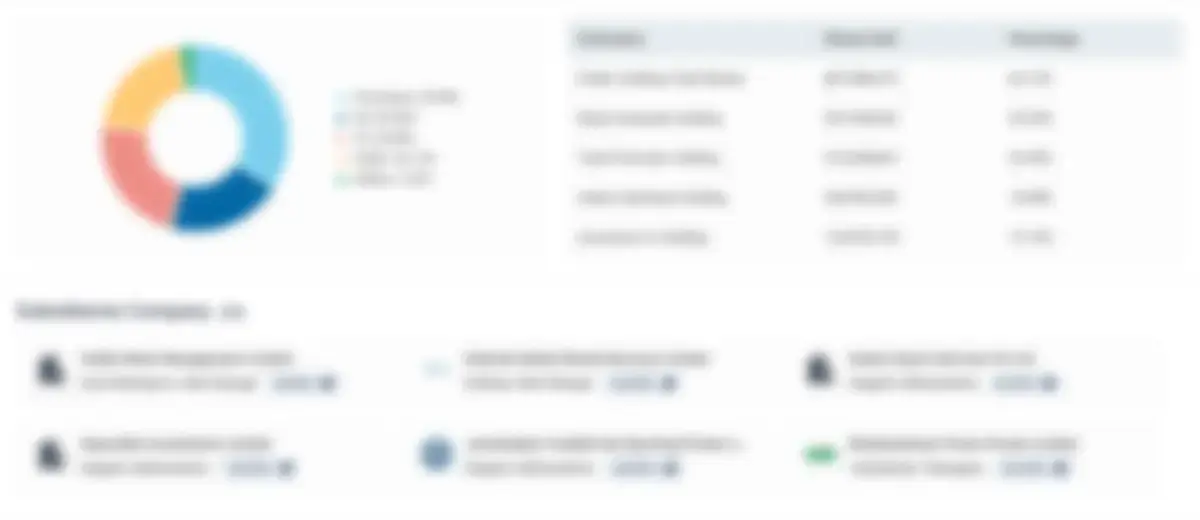
Charges (Loans)
₹8.80 Cr
₹3.00 Cr
Charges Breakdown by Lending Institutions
- State Bank Of India : 4.90 Cr
- Reliance Home Finance Limited : 2.20 Cr
- Others : 0.92 Cr
- Hdfc Bank Limited : 0.78 Cr
Latest Charge Details
| Date | Lender | Amount | Status |
|---|---|---|---|
| 20 Mar 2018 | Others | ₹0.03 M | Open |
| 03 Sep 2016 | Others | ₹9.20 M | Open |
| 03 Aug 2015 | Reliance Home Finance Limited | ₹2.20 Cr | Open |
| 18 Feb 2015 | Hdfc Bank Limited | ₹7.80 M | Open |
| 27 Mar 2012 | State Bank Of India | ₹4.90 Cr | Open |
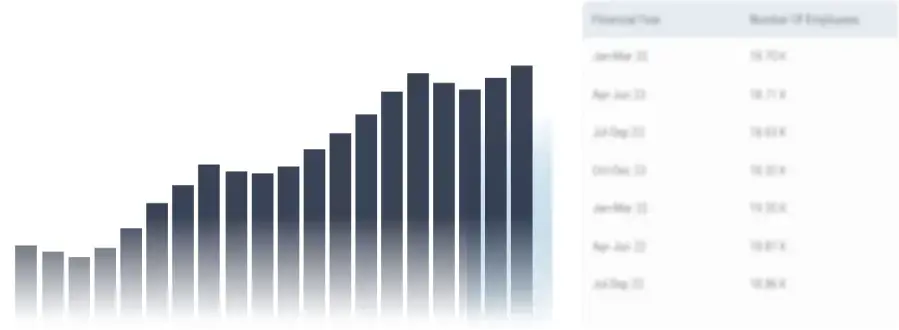
How Many Employees Work at Tybros (India) Tours?
Tybros (India) Tours has a workforce of 28 employees as of Apr 08, 2024. Unlock access to detailed historical data on individuals associated with the company, including employment records, contributions to the Employees' Provident Fund Organization (EPFO), and other related insights.
Deals i

Gain comprehensive insights into the Deals and Valuation data of Tybros (India) Tours, offering detailed information on various transactions, including security allotment data. Explore the intricate details of financial agreements, mergers, acquisitions, divestitures, and strategic partnerships that have shaped Tybros (India) Tours's trajectory.
Rating

Access the credit rating data, providing valuable insights into the company's creditworthiness and financial stability. Explore assessments from leading credit rating agencies, evaluating factors such as debt obligations, liquidity, profitability, and overall financial health.
Alerts

Stay informed about regulatory alerts and litigation involving and associated companies. Receive timely updates on legal proceedings, regulatory changes, and compliance issues that may impact the company's operations, reputation, and financial performance. Monitor litigation involving subsidiaries, joint ventures, and other affiliated entities to assess potential risks and liabilities.